Correcting the Target Color and the Tone Value Curve
The target color of an ink describes how the ink will be printed (and measured) in the print production using the production material, and is as such the reference for the proof.
You can correct the target value of the solid ink as well as the tone value curve in the characterization. Properties of the characterization are handled as defaults for all projects using this characterization. Those properties can be changed on the project level. These changes apply only to this project and all separation rules created from this project.
- From a Characterization or Project, on the Tools & Actions panel, click Color Corrections.
- From the ink list on the left, select any ink.
- You can also hold down the CTRL button to select multiple inks.
- Change the Target Mode. Select Custom to directly edit the target value.
The target value of the selected inks will be changed accordingly and the preview will be updated.
Editing the Target Color.
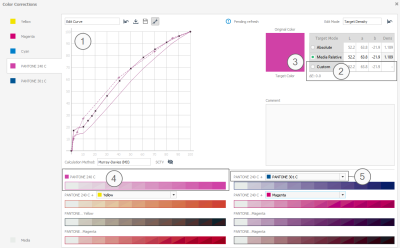
In the screenshot, a single ink "PANTONE 240 C" is selected.
The graph (1) shows the tone value behavior of the selected ink (see "Tone value curve").
You can change the Target Mode and directly enter a custom target value (2) for the solid ink (see "Target Mode"). The preview of the solid ink (3) and the tone value behavior (4) will be updated accordingly. For each color tone, the preview shows both the color values from the characterization (top left) and the color values that will be used in the profile (bottom right). You can select additional inks to show the overprint behavior (5). This way, you can easily see how color corrections will affect the profile.
The Target Mode can be set in the characterization. The mode set in the characterization is handled as a default value for all input projects using this characterization. It can then be changed in the input project. This change applies only to this project and all separation rules created from this project.
| Option | Description |
|---|---|
| Absolute |
This is the best option for most applications. The target full tone (100%) from the characterization will be preserved. Changes in the print medium used in the project will be ignored. The printed spot color will match the swatch book. |
| Media Relative | The target color will be recalculated to simulate the print results on the print medium used in the project. The Density value can still be changed, to reflect last minute changes during the final printing process. |
| Custom | You can enter a custom Lab or Density value as the target value for the selected color. |
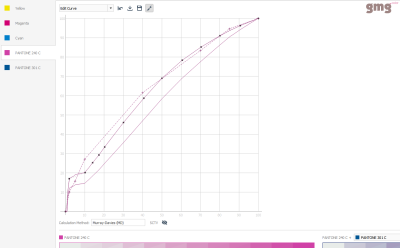
In the graph, you can see three tone value curves as explained in the following table. The Calculation Method used to calculate the curves is shown in the drop-down list. You can switch the method as long as you do not have manually edited the curve or loaded a gradation curve.The graph will be updated accordingly.
| Line | Shown data | |
|---|---|---|

|
Dashed line in ink color | Original tone value behavior derived from the characterization. |

|
Solid line in ink color | Actually used tone value behavior which will be simulated in the proof. The application calculates this curve from the original and target curve. If you are working in Murray-Davies (MD) mode, you can click the eye button to show and hide the SCTV curve and vice versa. |

|
Dashed gray line, black data points | Loaded target gradation curve. On the drop-down list, you can click Load Curve to load a gradation curve from the database. On the drop-down list, you can click Edit Curve and then click the line to add or move data points. As the line is usually partially overlaid with the actually used tone value curve, it might be difficult to see the dashed gray line in the graph. |
If you want to simulate a printing condition with a different ink behavior, you can change the tone value curve of one or multiple inks in the project.
It is not possible to change the Calculation Method after you have manually edited the curve or loaded a gradation curve. If you want to switch to another Calculation Method, you will need to reset the curve. However, GMG OpenColor allows you to view a Murray-Davies curve in SCTV mode and vice versa, so that you can see how it would look like.
- From a Characterization or Project, on the Tools & Actions panel, click Color Corrections.
- From the ink list on the left, select any ink.
- From the drop-down list, select Load Curve.
The Select Gradation from Database dialog box will be displayed. It will show only gradations of the type Tonecurve. - Select a gradation from the list and confirm with OK.
—OR— - Click the Import button to import a text file.
The graph and the preview will be updated accordingly.
See also:


