Optimizing the Profile Quality
If you want to improve the profile quality, you can do so by repetitive printing and measuring of a test chart. After each optimization cycle, the profile needs to be exported again for the next test chart print in GMG ColorProof.
- In a Project, select a halftone proof profile and click the Iterate button on the Actions bar.
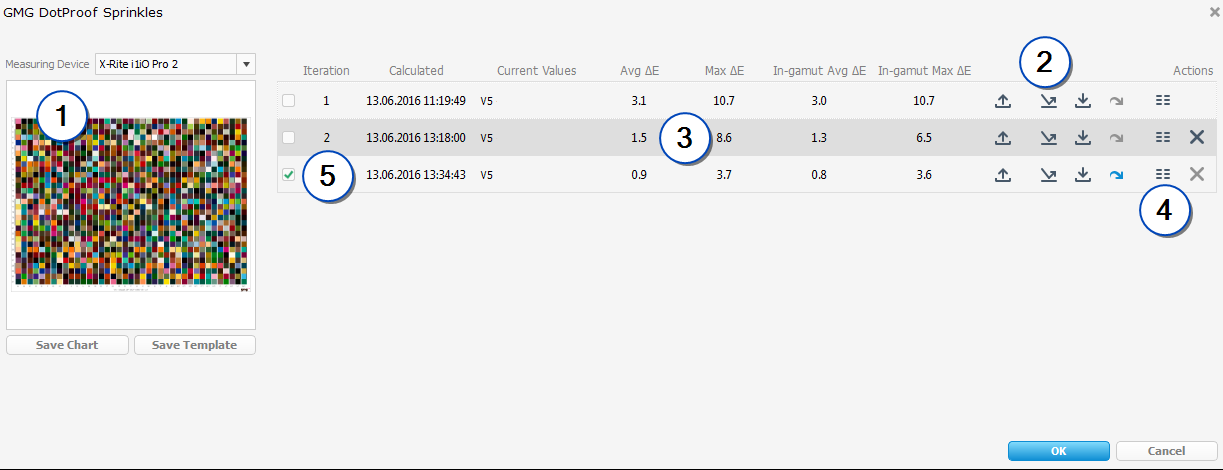
Iteration dialog box.
The application will show you a preview of the test chart (1) and a list of the iteration cycle results. The integrated test chart generator helps you to find the best patch configuration by automatically selecting the relevant patches for your printing process, inks, and measuring device.
To optimize the profile, you will need to save the test chart as a PDF and process it in your imagesetter RIP. Print the resulting 1-bit files in GMG ColorProof with the exported DotProof profile, as described below.
Then, open this dialog box again and click the Measure Chart button (2) to measure directly in GMG OpenColor. Alternatively, you can measure in 3rd party software and import the measurement.
Measurement values are listed as Current Values with average and maximum Delta E (3). A detailed list with all values can be displayed by clicking the Statistics button (4).
Repeat this procedure until you are satisfied with the results. In case of several iterations, select the iteration you want to use by marking it with a green check mark (5).
Printing the 1-Bit Test Chart Files
The 1-bit TIFF files of the test chart should be produced under exactly the same target printing conditions you want to simulate.
- Start GMG ColorProof.
- Create a new job in GMG ColorProof and load the 1-bit TIFF files of the test chart, marking all four separations.
- Under Merge files, select a recognition pattern (for example Generic 1-bit).
- Ignore the other options in this dialog box and click Open to edit the job in the Manual Job Manager.
- Job > Printer Settings > Printer: From the Printer list, select your printer.
- Job > Printer Settings > Printer: From the Medium list, select the loaded medium.
- Job > Printer Settings > Printer: Under Calibration Set, select the calibration set with the print mode you will use for printing the proofs later.
- Image > Color Management > Proof Output: From the Proof Standard list, select Custom. As Proof Profile, select the MXD DotProof profile you are creating.
(Each iteration changes the profile, please make sure to always use the latest profile for test chart printing.) - Click the Print button on the toolbar to print the job.